Market Brief · by Aidan Sowa · October 5, 2026
Do Tenafly Buyers Still Pay Over Asking, or Is That a Winter Figure That Has Gone Stale? Reading the Old Pages, the Family Houses and the Aging Stock
Reading the Old Pages, the Family Houses and the Aging Stock for Tenafly, NJ, with each source dated and its limits noted, for owners weighing a listing against a direct sale.
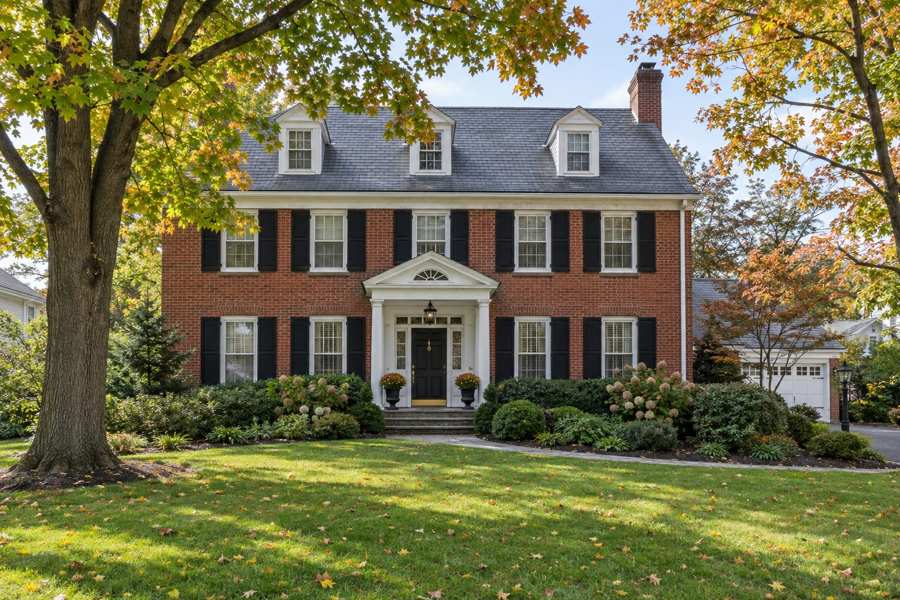
Do Tenafly buyers still pay over asking, or is that a winter figure that has gone stale? Both. Redfin's page for the postal area that includes Tenafly shows, for February 2026, a median sale price of $1,700,000, up 21.4% in a year, a sale-to-list ratio of 102.4% and 41.9% of homes sold above list. But February is eight months old, and Realtor.com's page for the same area carries key indicators as of March 2026, also stale, with 15 active listings.
The two pages are the newest that the publishers show for this area, and they describe winter and early spring, when few homes sell. Only 31 homes sold in the month Redfin reports. The Census adds a steadier picture: of 15,319 people counted, 4,722, or 30.8%, are under 18, and of 5,420 housing units, 3,696, or 68.2%, were built before 1980.
Maison Off-Market speaks only to sellers, and this brief is for an owner in Tenafly. It uses the name from the sheet, and the figures describe a postal area. Every figure is dated and linked, the arithmetic is shown, and inferences are labeled. Where a page is old or implausible, the text says so and does not rely on it.
Key Findings
- Redfin's page for the postal area gave monthly figures for February 2026, eight months before this brief: a median sale price of $1,700,000, up 21.4% from a year before, $630 per square foot, up 22.6%, 31 homes sold, up 24.0% from 25, and a median of 82 days on market, two fewer than a year earlier. The sale-to-list ratio was 102.4%, up 0.02 points, and 41.9% of homes sold above list, down 6.1 points. Redfin scored the area 56 out of 100, somewhat competitive, with the average home selling about 3% above list and going pending in around 93 days, and hot homes selling about 12% above list in around 65 days (Redfin, postal area housing market).
- Realtor.com's page, with key indicators as of March 2026, showed a median listing price of $2,500,000, up 39.90% in a year and up 75.44% in three years, 15 active listings, down 45.83% and down 76.36%, a median of 25 days on market, up 31.58% and up 13.64%, 31 rental properties, down 6.67%, and a median rent of $5,875 a month, up 17.50% and up 18.69%. The page also shows $164 per square foot, down 38.11%, which cannot be squared with Redfin's $630 and was not used (Realtor.com, postal area housing market). It shows no sold median. The neighborhood tables were not used.
- Zillow's page for the postal area showed an average home value of $1,218,495, up 5.4% over the past year (Zillow, Tenafly home values). The page shows no update date, so its age is unknown.
- In the Census postal area, 5,420 housing units were counted, 5,227 occupied, 3,749 by owners and 1,478 by renters, and only 193 vacant, of which 121 were for sale only and none for seasonal use. The median build year is 1958, the median owner value $1,002,600, plus or minus $59,250, the median household income $208,200, plus or minus $17,786, and the median rent is capped at $3,501, meaning $3,500 or more (U.S. Census Bureau, American Community Survey 2020-2024 five-year estimates, tables B01001, B19013, B25003, B25004, B25034, B25064 and B25077).
- Redfin's median of $1,700,000 is 1.7 times the Census median owner value of $1,002,600, and the Zillow index of $1,218,495 sits between them. The three measure different things and different dates, and the Census owner value, which is an average over five years of owners' own estimates, lags a market that has risen.
Which Tenafly price figure should an owner trust?
The February median is the only sale figure, and it comes from 31 sales. Redfin's $1,700,000, up 21.4%, implies about $1,400,329 a year earlier. A rise of that size in a month with so few sales may reflect which homes happened to close, and an owner should not read it as a rise in every home's value. Zillow's index of $1,218,495, up 5.4%, implies about $1,156,067 a year earlier, and a rise of 5.4% is a slower and more believable pace. That reading is an inference.
Realtor.com's listing median of $2,500,000, up 39.90%, implies about $1,786,991 a year earlier, and up 75.44% in three years it implies about $1,424,989. With only 15 listings, a listing median can swing on a few estates. It is 47.1% above Redfin's February sale median, computed here, and the months differ. Neither measures what a particular house would bring.
Price per foot is the cleaner Redfin figure. At $630, up 22.6%, it implies about $514 a year earlier. Realtor.com's page shows $164 per square foot, down 38.11%, which is 74.0% below Redfin's and far too low for a place where the median sale price is $1,700,000. It is likely a data error or a different measure, and it was set aside. Pages sometimes carry such figures, and a careful reader checks one against the other.
The Census figure is lower and older. The median owner value of $1,002,600, plus or minus $59,250, is 41.0% below Redfin's February median and 17.7% below Zillow's index, computed here. It is 4.8 times the median household income of $208,200, and Redfin's median is 8.2 times. Owners' own estimates tend to lag a rising market, and that is an inference.
An owner should ask any buyer or adviser which source and which month they are quoting. A figure from February says little about October, and a listing median says little about a sale. The best number for a given house is a closed sale of a similar house nearby in the last few months, adjusted for size, lot and condition.
Stale pages carry a lesson. An owner who is told that homes in the town sell above asking should ask when, how many homes and of what kind. If the answer is a winter month with a few dozen sales, the figure is a clue and not a promise. Two or three closed sales from the last quarter, on streets near the house, are a sturdier guide than any page here, and an owner can collect them before any offer is discussed.
| Source | Figure | What it measures |
|---|---|---|
| Census Reporter | $1,002,600 | Median owner value, postal area |
| Zillow | $1,218,495, up 5.4% | Home value index, no date shown |
| Redfin | $1,700,000, up 21.4% | Median sale price, February 2026, 31 sales |
| Realtor.com | $2,500,000, up 39.90% | Median listing price, March 2026, 15 listings |
Sources as cited. Ratios and year-earlier values in this section are computed from the published figures and percentages.
Do Tenafly homes still sell above asking?
In February they did, often. Redfin shows a sale-to-list ratio of 102.4%, which means a typical sale closed 2.4% above the final list price, and 41.9% of homes sold above list, down 6.1 points, which implies about 48.0% a year earlier. Its text says the average home sold about 3% above list and went pending in around 93 days, and hot homes sold about 12% above list in around 65 days. On the February median, 2.4% is about $40,800, simple arithmetic and not a claim about any home.
Days on market tell a slower story. Redfin shows a median of 82 days, two fewer than a year earlier, and its text says 93 days to a pending sale. Realtor.com shows 25 days on listings, up 31.58%, which implies about 19 days a year earlier, and up 13.64% in three years, which implies about 22. The clocks differ, and a winter market is slow in any case. The gap between 82 days and 25 days shows that the measures count different things.
Supply is very low. Realtor.com shows 15 active listings, down 45.83% in a year, which implies about 28, and down 76.36% in three years, which implies about 63. Against 31 sales in February, 15 listings is about 0.5 months of sales, a rough guide that mixes a March count with a February count. Low supply is the usual reason homes sell over asking, and it favors a seller who is ready.
Rentals are costly and steady. Realtor.com shows 31 rental properties, down 6.67% in a year, which implies about 33, and a median rent of $5,875, up 17.50%, which implies about $5,000 a year earlier, and up 18.69% in three years, which implies about $4,950. The Census median rent is capped at $3,501, so the two cannot be compared directly, and the listed rent is at least 67.9% above the cap.
A seller in a thin market with homes selling over asking faces a different choice from one in a slow market. The chance of a bidding contest is real, and so is the cost of preparing a house for showings that may draw many visitors. An owner who values discretion may weigh a private offer against that chance, and an owner who wants the highest possible price may choose a public listing. The pages cannot decide for the owner.
Timing in a school town is also seasonal. Families who want to be settled before the school year tend to search in spring and close in summer, which means a house listed in autumn meets fewer buyers who are in a hurry. That is an inference about how family moves are scheduled and not a finding from any page, and it is worth weighing against the pace of the market. A private sale that closes on the owner's chosen date does not depend on that calendar.
Sources as cited. Year-earlier values and differences are computed from the published percentages.
Who lives in Tenafly homes, and why does that matter to a seller?
Owners are the majority. Of 5,227 occupied homes, 3,749 are owner-occupied, 71.7%, and 1,478 are rented, 28.3%. Of 5,420 units, only 193 are vacant, 3.6%: 121 are for sale only and 72 are vacant for other reasons. None are counted as seasonal. Vacancy this low means few empty houses, and the 121 homes for sale are 2.2% of all homes.
The area is rich in children. Of 15,319 people counted, 4,722, or 30.8%, are under 18, 666, or 4.3%, are 18 to 24, 749, or 4.9%, are 25 to 34, 2,350, or 15.3%, are 35 to 44, 4,648, or 30.3%, are 45 to 64 and 2,184, or 14.3%, are 65 or older. The margin on the total is plus or minus 32. Households with children are the usual buyers of large houses in good school districts, and that is an inference.
Owners have mixed tenure. Of 3,749 owner households, 57 moved in during 2023 or later, 1.5%, 378 between 2020 and 2022, 10.1%, 1,579 between 2010 and 2019, 42.1%, 700 between 2000 and 2009, 18.7%, 488 in the 1990s, 13.0%, and 547 before 1990, 14.6%. So 46.3% moved in before 2010. Renters are newer: of 1,478, 139 moved in 2020 to 2022 and 686 between 2010 and 2019.
Houses are large. Of 3,749 owner households, none live in a home with no bedroom, 70 in a one-bedroom, 234 in a two-bedroom, 857 in a three-bedroom, 1,642 in a four-bedroom and 946 in one with five or more. Homes with four or more bedrooms are 69.0% of owner homes and three-bedroom homes 22.9%. A household whose children have grown up may weigh a smaller home, which is a common reason to sell, though no table records the reason.
Costs weigh on many. Of 2,397 owners with a mortgage, 2,371 with a computed figure, 675 spent 30% or more of income on housing, 28.5%, and 366 spent half or more, 15.4%. Of 1,352 owners without a mortgage, 1,332 with a computed figure, 296 spent 30% or more, 22.2%, and 140 spent half or more, 10.5%. Of 1,478 renters, 1,368 with a computed figure, 487 spent 30% or more, 35.6%, and 334 spent half or more, 24.4%. Owners without a mortgage are 36.1% of owners.
A household with teenagers faces a particular timing question. Moving before the end of a school year may cost the children a season, and moving after it may mean waiting a year. Owners in that position often value a firm closing date more than a slightly higher price, and the pages cannot weigh that. It is one of the reasons the second benefit of a private sale, a closing date that fits the seller, can matter more to a family than the headline number.
Source: U.S. Census Bureau, American Community Survey 2020-2024 five-year estimates, tables B01001, B25003, B25004, B25038, B25042, B25070 and B25091, via Census Reporter. Shares are computed here.
How old are Tenafly houses, and what does a buyer find?
The stock is old. Of 5,420 units, 1,331, or 24.6%, were built before 1940, 431, or 8.0%, in the 1940s, 1,215, or 22.4%, in the 1950s, 371, or 6.8%, in the 1960s, 348, or 6.4%, in the 1970s, 407, or 7.5%, in the 1980s, 340, or 6.3%, in the 1990s, 336, or 6.2%, in the 2000s, 524, or 9.7%, in the 2010s and 117, or 2.2%, in 2020 or later. The median build year is 1958, and 68.2% were built before 1980.
Homes built before 1950 are 32.5% of the stock, which is a high share. Houses of that age often have fine lots and good bones, and often have old wiring, plumbing, oil or gas heating equipment, plaster walls and small bathrooms. Tear-downs and large additions are common in places like this, and a buyer may value the lot above the house. That is an inference from the age of the stock and not a finding from any source.
The 2010s produced 9.7% of the stock, more than the 1980s, the 1990s or the 2000s, and that is probably infill and replacement of older houses, which is an inference. New houses sit beside old ones, and their prices differ greatly, so a median is a blend of two kinds of home.
Most homes are detached. Of 5,420 units, 4,124, or 76.1%, are detached, 332, or 6.1%, are attached, 300 are in two-unit buildings, 129 in buildings of three or four units, 197 in five to nine, 99 in ten to nineteen, 109 in twenty to forty-nine and 130 in fifty or more. There are no mobile homes in the count. Apartment buildings are a small part of the whole, about 9.9%.
A buyer of an older house will want the roof, the heating system, the electrical panel, the sewer line, the oil tank if one exists, the chimney and the foundation checked. In a market where buyers have waived inspections, a seller may avoid repairs, and in a slower one a buyer may ask for credits. Selling as is to a buyer who has priced the work avoids both. That is the argument for a private sale, and the owner can weigh it against the chance of a bidding contest.
Lot size matters as much as house size. Two houses of the same age and square footage can differ by hundreds of thousands of dollars in value because of the lot, the street and the school boundary that goes with it. A buyer who plans to rebuild will price the land and subtract the cost of tearing down, and a buyer who plans to live in the house as it is will price the condition. Each approach gives a different figure for the same property. Readers comparing markets can also read the Manahawkin brief and the Ocean City brief.
Source: U.S. Census Bureau, American Community Survey 2020-2024 five-year estimates, tables B25004, B25024, B25034 and B25042, via Census Reporter. Shares are computed here.
What should a Tenafly owner ask before choosing a listing or a private sale?
Five questions are worth asking. Is my price based on closed sales of houses like mine in the last few months, and not on a median from February? Do I want to show the house and take offers in a market that was selling over asking? What will a buyer's inspector find in a house of this age? What do the fees cost? And what date do I need to close?
Fees are simple arithmetic, and no rate is assumed here. Each 1% of a $450,000 sale is $4,500, of a $725,000 sale is $7,250 and of a $1,200,000 sale is $12,000. Three percent is $13,500, $21,750 and $36,000, and five percent is $22,500, $36,250 and $60,000. On Redfin's February median of $1,700,000, 1% is $17,000, 3% is $51,000 and 5% is $85,000. On the Zillow index of $1,218,495, 1% is $12,185, 3% is $36,555 and 5% is $60,925.
A private sale has no showings and no neighbors talking about it, which is the first benefit. In a town where neighbors know each other and children share schools, a quiet sale is a plain advantage. The second benefit is a closing date that fits the seller, which helps a household that needs time to find a new home or to finish a school year. The third and fourth are no commission costs and no closing costs, and the fifth is no inspection repairs.
In a market where many homes sold over asking, an owner is right to compare a listing with a private offer. The comparison includes the chance of competing bids, the weeks of preparation and the cost of repairs. Only the owner can supply the numbers for taxes, upkeep and plans.
Maison Off-Market buys luxury homes and estates directly from their owners and speaks only to sellers. It does not say that a private sale always beats a public listing. If you would like a private, no-obligation offer for a home in Tenafly, call 401-219-4207 or use the contact form on this site.
Sources as cited. Fee illustrations are arithmetic only and assume no commission rate.
Methodology and limitations
Each page's date, title and place were read before use. The Redfin page carries monthly figures for February 2026, eight months old, from only 31 sales. The Realtor.com page carries key indicators as of March 2026, and its price-per-foot figure is far from Redfin's and was not used, and its neighborhood tables were not used. The Zillow page shows no update date. All three are older than the August data in other briefs in this series, so they are not current figures. The Census median rent is a cap. Only established data publishers and the Census are cited. Percent changes were taken as printed, and ratios, sums, fee figures and year-earlier values are this brief's arithmetic.
Conclusion
The record for Tenafly, as of winter and early spring, is a median sale price of $1,700,000 from few sales, more than four homes in ten sold above list, very few listings, a stock in which more than two homes in three were built before 1980, and a population with many children. The useful number for an owner is a closed sale of a comparable house nearby in the last few months, and a private buyer can price the house as it stands and close on the owner's schedule.
Frequently Asked Questions
What is the median home price in Tenafly?
Redfin showed a median sale price of $1,700,000 for February 2026, from 31 sales, for the postal area. The Census median owner value is $1,002,600 and Zillow's index was $1,218,495.
Do Tenafly homes sell over asking?
Redfin showed a sale-to-list ratio of 102.4% and 41.9% of homes sold above list for February 2026.
How many homes are for sale in Tenafly?
Realtor.com showed 15 active listings for March 2026, down 45.83% in a year.
How old are Tenafly homes?
The Census median build year is 1958, and 3,696 of 5,420 units, 68.2%, were built before 1980.
Can I sell my Tenafly home privately?
Yes. Maison Off-Market buys luxury homes and estates directly from their owners with no showings, flexible closing dates, no commission costs, no closing costs and no inspections or repairs. Call 401-219-4207 or use the contact form.
Compare your options before committing. Request a written private offer for your property, with no obligation, then weigh it against your listing plan.
Sources
- Redfin, postal area housing market, 2026. 07670 Housing Market Trends. https://www.redfin.com/zipcode/07670/housing-market.
- Realtor.com, postal area housing market, 2026. 07670 Housing Market Data. https://www.realtor.com/local/market/new-jersey/zipcode-07670.
- Zillow, Tenafly home values, 2026. 07670, NJ Housing Market. https://www.zillow.com/home-values/60751/tenafly-nj-07670/.
Related research

Seller Guide · October 6, 2026
How to Prepare Point Pleasant Beach Rental Records Before Selling
Separate rental approval, income history and booked stays before comparing sale terms.

Seller Guide · October 6, 2026
How to Prepare Rumson Flood and Waterfront Records Before Selling
Separate flood disclosure, elevation, repairs and waterfront rights before comparing sale terms.

Seller Guide · October 6, 2026
How to Prepare Sarasota Condo Inspection and Reserve Records Before Selling
Separate building condition, reserve funding and resale documents before comparing sale terms.