Market Brief · by Aidan Sowa · October 5, 2026
Did Lexington Prices Rise or Fall? Reading a Typical Value and a Redfin Median
Reading a Typical Value and a Redfin Median for Lexington, MA, with each source dated and its limits noted, for owners weighing a listing against a direct sale.
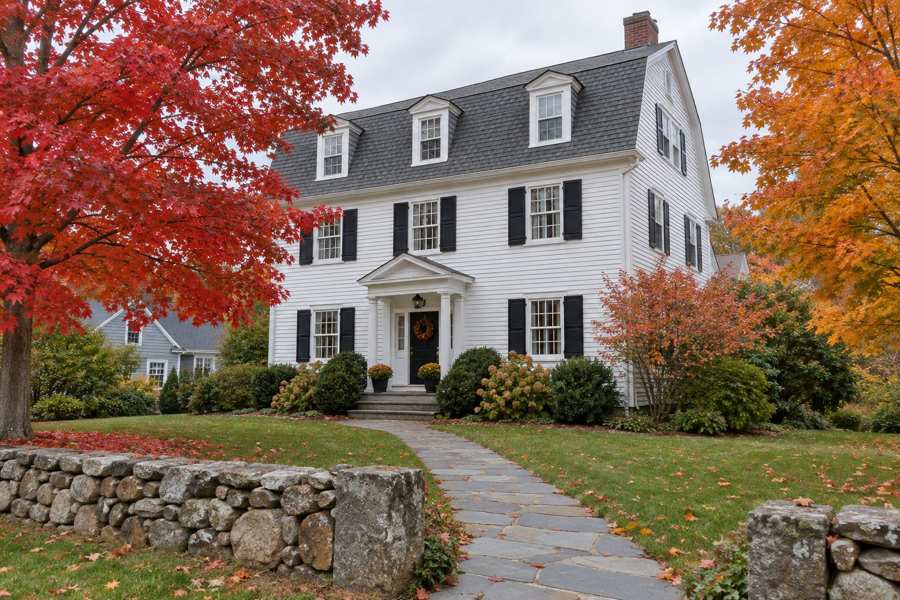
Did Lexington prices rise 12.4% or fall 13.8%? Both are published for 2026. Zillow shows a typical home value of $1,593,394 for Lexington, up 12.4% on the year. Redfin shows a median sale price of $1.6 million for the three months to August, down 13.8%. Realtor.com's June page shows a median sold price of $1,726,500, down 12.03%, beside a median listing price of $2,395,000 that fell 5.58%. A brokerage report built from the MLS shows a single-family average of $1,990,000 on 86 sales, down 7.1%, while a second report cited alongside it shows the median up about 17.5%. A seller who wants to know whether the market rose or fell has four answers.
The answers differ because they measure different things. A typical value estimates every home in town, whether or not it sells. A sold median is what closed in a window, and in a town of this size that is a small number of homes. An average moves with the biggest sales. Two brokerage articles on the subject reach the same conclusion from different sides: the average fell because of which homes closed, and they say the 7.1% fall describes the mix of sales and not the worth of a home.
Maison Off-Market buys luxury homes and estates directly from their owners and speaks only to sellers. We do not appraise homes, and nothing here is a valuation. This brief sets the published figures side by side, notes where pages are stale or conflict, adds a Census cut on the age of the homes and how long owners have stayed, and shows what a percentage of a price is worth in dollars. Every calculation is this brief's own arithmetic and every inference is labeled as one.
Key Findings
- Realtor.com's Lexington page, with indicators dated June 2026 in the version fetched, showed a median listing price of $2,395,000 (down 5.58% on the year), a median sold price of $1,726,500 (down 12.03%), $568 per square foot, 192 active listings (up 50%), 27 days on market and 112 rentals (Realtor.com, Lexington market data).
- Redfin showed a median sale price of $1.6 million for the three months to August 2026, down 13.8%, $544 per square foot, 28 days on market against 16 a year earlier, 4 offers on average, 146 homes sold in August against 123, a sale-to-list ratio of 100.8%, 40.2% of homes sold above list and 34.6% with price drops (Redfin, Lexington housing market).
- Zillow showed a typical home value of $1,593,394, up 12.4% on the year, with homes going to pending in around 7 days; the page carried no update date in the version fetched (Zillow, Lexington home values).
- A brokerage article dated September 15 reported a single-family average of $1.99 million across 86 closed sales in 2026, down 7.1%, at $594 per square foot and 101.15% of asking (Local brokerage blog, Lexington price slip is a mix story). A second brokerage article dated September 29 reported months of supply up from 2.94 to 4.23 and the share of sales above asking down from 82.14% to 43.75% (Local brokerage blog, Lexington 4.23 months of supply).
- The Census describes a postal area of 18,080 people where 61.6% of homes were built before 1980, the median year built is 1967, 75.9% of occupied homes are owner-occupied and only 1.1% of homes are vacant.
Is Lexington a buyer's market, a seller's market or a balanced one?
The pages that use words call it competitive. Redfin calls it very competitive, with 4 offers on average and a compete score of 70 out of 100, and its August sale-to-list ratio is 100.8%. Realtor.com's June page says Lexington has 192 active listings and calls the supply relatively tight. Zillow shows homes going to pending in around 7 days, which is the fastest clock on any page in this brief.
The numbers underneath show a market that is cooling from a very hot year. Redfin's ratio of 100.8% is down 2.2 points on the year, and the share of homes sold above list is 40.2%, down 17.5 points. At the same time the share with price drops is 34.6%, up 2.5 points. Days on market rose from 16 to 28, an increase of 75%, a figure this brief computes. The second brokerage article says the share of sales above asking fell from 82.14% to 43.75% and that price reductions rose from 20.89% to 31.43% of listings.
The same article reports that months of supply across all property types rose from 2.94 to 4.23, an increase of 44%, and that average days to offer rose from 20 to 33. It also says in a later passage that months of supply reached 4.24, up from a prior reading of 0.75, which does not match the 2.94 earlier in the same article. This brief flags that inconsistency and uses neither prior figure as a fact. The article's data are dated June 3 by its own text, so they are about four months older than the article's September 29 date.
The inference from the pages together is that Lexington was a strong seller's market in 2025 and has become a market in which a well-priced home still sells quickly, with buyers negotiating more on homes that sit. Every page agrees on the direction, and none of them agrees on the size.
| Measure | Value | One-year change | Three-year change |
|---|---|---|---|
| Median listing price | $2,395,000 | -5.58% | 9% |
| Median sold price | $1,726,500 | -12.03% | 19.07% |
| Price per square foot | $568 | -2.63% | 7.46% |
| Active listings | 192 | 50% | 112.20% |
| Median days on market | 27 | 68.42% | 45.45% |
| Rental properties | 112 | -7.69% | -2.44% |
Source: Realtor.com Economic Research, as shown on the page. Commercial content; not independently verified. The page's date is June 2026 and is stale for a September reader.
Did Lexington prices rise or fall?
Zillow says up 12.4%. Redfin says down 13.8%. Realtor.com says the sold median fell 12.03%. The brokerage's average fell 7.1% and its median rose about 17.5%. Four of these figures cannot all describe the same homes. The explanation the two brokerage articles give is the mix: with 86 sales in a year, a few missing top-end closings pull an average down, and a different set of sales moves a median in either direction.
The ratios show how far apart the levels are. Zillow's $1,593,394 is 0.4% below Redfin's $1.6 million, which means that the typical value and the sold median agree closely on the level, while they disagree by 26 points on the direction of change. Realtor.com's $1,726,500 is 7.9% above Redfin's and 8.4% above Zillow's. The average of $1,990,000 is 15.3% above the Realtor.com median and 24.4% above the Redfin median, ratios this brief computes. An average above the median by that much says that a number of very expensive homes sit at the top.
The brokerage articles also cite a price per square foot of $594, up 1.6%, as the figure that holds steady. Redfin's is $544, down 7.2%, and Realtor.com's $568, down 2.63%. These three differ by 9%, and they disagree on the sign, too. This brief does not choose among them. It records that a per-foot figure, which removes some of the effect of home size, moved by less than the medians on two of the three pages.
The Census owner value in the postal area is $1,205,700, with a margin of error of $52,318, or 4.3%. It sits 24.3% below Zillow's typical value, 24.6% below Redfin's median and 30.2% below the Realtor.com sold median. The Census asks owners what they think their homes are worth and averages five years, and the postal area includes homes of every size. A seller should expect that the market pages will describe prices well above this figure, and should not take the gap as a sign of anything wrong with either.
The dollars are large whichever figure applies. One percent of $1,600,000 is $16,000, one percent of $1,726,500 is $17,265 and one percent of $1,990,000 is $19,900. A seller who reads the wrong page for the home's segment can be off by a very large sum.
| Source | Figure | Change | What it measures |
|---|---|---|---|
| Zillow | $1,593,394 | +12.4% | Typical home value, page undated |
| Redfin | $1,600,000 | -13.8% | Median sale price, three months to August |
| Realtor.com | $1,726,500 | -12.03% | Median sold price, June |
| Realtor.com | $2,395,000 | -5.58% | Median listing price, June |
| Local brokerage | $1,990,000 | -7.1% | Average single-family sale, 86 sales, 2026 to early June |
| Local brokerage | About $1,700,000 | About +17.5% | Median sale price, as cited from a second report |
Sources as cited. The measures, areas and periods differ and the figures are not directly comparable. Commercial content; not independently verified.
How uneven are the homes behind the medians?
The articles say that Lexington is a town of mixed homes. They cite a single-family average of $1,990,000 and a median near $1,700,000, so half of the single-family homes sold for less than about $1.7 million and the average was pulled up by the largest sales. The gap between the two is $290,000, a figure this brief computes from the rounded numbers, and it is 17% of the median. A town where the average runs 17% above the median is a town with a long upper tail.
The Redfin page shows a similar pattern when it breaks the market by home type. It says that homes in Lexington can sell for about 3% above list price and go pending in around 20 days in one type, about 1% above list in around 19 days in another and about 4% above list in around 15 days in a third, and that the average home sells for around list price and goes pending in around 34 days. The page's headings, as fetched, did not carry the type labels with those sentences, so this brief does not say which type is which. The point is that the clocks vary by a factor of more than two within the town.
The Realtor.com page counts 192 active listings in June, up 50% on the year and 112.20% over three years, and 112 rentals, down 7.69%. The Redfin page counts 146 homes sold in August, up from 123. A count of 146 sales in a month against 192 listings in June suggests a turnover of weeks and not months, though the two counts are from different pages, different months and perhaps different boundaries, so this is a rough inference.
The practical point is that a Lexington median blends large houses on wooded lots, older Capes and colonials, and condominiums, and the right comparison for a particular home is the same size, the same condition and the same street type. None of the pages supply that. One of the brokerage articles says as much and advises pricing to a home's size and condition and not to the town average.
Source: Redfin, Realtor.com and the brokerage articles, as cited above. Ratios are this brief's arithmetic. Commercial content; not independently verified.
How long does a Lexington sale take, and how much competition is there?
The clocks run from 7 to 33 days. Zillow shows around 7 days to pending. Realtor.com's June page shows a median of 27 days on market, up 68.42% on the year. Redfin shows 28 days against 16 a year earlier, and the second brokerage article shows an average of 33 days to offer against 20. The ratio of the longest to the shortest is 4.7, and the pages measure different points in the sale, so they do not contradict one another.
Competition shows in the offers. Redfin counts 4 offers on average and calls the market very competitive. The 40.2% of homes that sold above list is down from 57.7% a year earlier, a figure this brief derives from the stated drop of 17.5 points. The 34.6% with price drops means that about one home in three cut its asking price, while about two in five sold above it. The ratio of the two shares is 1.2, so more homes sold above list than cut, but the margin has narrowed.
The sales counts support the cooling view only in part. Redfin counted 146 sales in August, up 19% on the 123 of a year earlier, a figure this brief computes. At the same time the first brokerage article counts only 86 single-family closings for the year to early June. The difference is the time window and the property types, and a reader cannot reconcile them from the pages.
Price cuts have a dollar meaning. A seller whose home sold at 100.8% of list on a $1,600,000 price would have received about $12,800 over the asking price, and one whose home sold at 97% would have given up about $48,000. These are illustrations of what a ratio means in dollars, and not predictions of any sale.
| Source | Figure | What it measures |
|---|---|---|
| Zillow | 7 days | Around the time to pending |
| Realtor.com | 27 days | Median days on market, June |
| Redfin | 28 days | Median days on market, three months to August |
| Local brokerage | 33 days | Average days to offer, as reported |
| Realtor.com | 192 | Active listings, June |
| Redfin | 146 | Homes sold, August |
| Local brokerage | 86 | Single-family closings, 2026 to early June |
Sources as cited. Commercial content; not independently verified.
What does the Census say about the homes and the owners?
The Census describes a postal area of 18,080 people and 6,903 homes with a median household income of $227,813 and a median rent of $2,948. Of the homes, 4,254 (61.6%) were built before 1980, and the median year built is 1967. By decade, 1,482 homes (21.5%) date from 1939 or earlier, 300 (4.3%) from the 1940s, 1,174 (17.0%) from the 1950s, 702 (10.2%) from the 1960s, 596 (8.6%) from the 1970s and 567 (8.2%) from the 1980s. Newer homes are fewer: 425 (6.2%) from the 1990s, 864 (12.5%) from the 2000s, 712 (10.3%) from the 2010s and 81 (1.2%) since 2020. Homes built before 1940 number 1,482, which is more than any other single decade.
The age of the stock matters because one in five homes dates from before 1940. A buyer of such a house expects to inspect it and price the roof, the wiring and the heating, and the age of the stock explains why the articles stress condition and finish when they say to price to the home. This is an inference about how buyers behave.
Of 6,824 occupied homes, 5,180 (75.9%) are owner-occupied and 1,644 (24.1%) are rented, and only 79 homes (1.1%) are vacant. Of those, 70 are for rent and 9 are in other categories, and none is listed as for sale only, held for seasonal use or sold and not occupied. A vacancy rate of 1.1% means that almost every home in the postal area is lived in, which fits a tight market.
The Census also asks when owners moved in. Of the 5,180 owners, 1,843 (35.6%) moved in in the 2010s, 1,073 (20.7%) in the 2000s, 986 (19.0%) in the 1990s, 664 (12.8%) in 1989 or earlier, 505 (9.7%) in 2020 to 2022 and 109 (2.1%) in 2023 or later. Owners who moved in before 2000 number 1,650, or 31.9%, and many bought before the long rise in prices. Owners who moved in since 2020 number 614, or 11.9%.
The Census median owner-occupied value is $1,205,700. Many owners have lived in their homes for decades, and the figures show that the decision about whether and when to sell is theirs to make, with no deadline from the market. Readers comparing markets can also read the Needham brief and the Wellesley Farms brief.
Source: Census Reporter, American Community Survey 2020-2024 five-year estimates, tables B25034, B25038, B25004, B25077, B25003, B25002 and B19013. Percentages and ratios are this brief's arithmetic.
What should an owner ask, and what does a private sale change?
Ask which Lexington a figure covers: the town, the postal area, single-family homes only or all property types. Ask which period and how many sales are behind it. Ask whether a price is a listing price, a sold price, an average or an estimate. A seller who has the answers can read a page, and a seller who does not will find that four sources disagree on the direction of prices.
A private sale changes how a home reaches a buyer. With Maison Off-Market there are no showings and no neighbors talking about a sale, the closing date can be flexible so that an owner has time to find a new home, there are no commission costs, there are no closing costs and there are no inspections or repairs. For an owner of a pre-1940 house, the last point matters, because an older home is where an inspection list tends to grow. This brief does not claim that a private sale always brings a higher price than a public listing.
Fee arithmetic shows what the commission point means in dollars, without assuming any rate. Each 1% of a sale price is $16,000 at $1,600,000, $17,265 at $1,726,500 and $19,900 at $1,990,000. At 3% those amounts are $48,000, $51,795 and $59,700. At 5% they are $80,000, $86,325 and $99,500. These are illustrations of what a percentage means on the figures in this brief, and they are not a statement of what any agent charges or what any sale would cost.
Timing is the other thing an owner controls. A public listing starts a clock, and the pages above show 7 to 33 days, with the brokerage noting that listings that sit take longer. A private sale lets the owner choose the closing date, which matters most to people who need to find the next home first or who want to close after a school year.
Privacy is often the first thing owners raise. A public listing puts photographs, a price and every price change in front of anyone, and one report says about one in three listings cut their price, a fact neighbors can read. A private sale keeps those details out of view. That is a matter of preference and not a claim about price.
If you are weighing a sale of a Lexington home, one conversation costs nothing and obliges you to nothing. We ask about the home, the timing you would like and what you would need from a buyer, and we say plainly whether a private sale fits.
If you would like a private, no-obligation offer for a Lexington home, call 401-219-4207 or use the contact form on this site.
Methodology and limitations
Prices, days on market, counts and ratios come from a Realtor.com page whose fetched version shows indicators as of June 2026, a Redfin page showing the three months to August 2026, a Zillow page with no update date in the fetched version, and two brokerage articles dated September 15 and September 29, 2026 that quote MLS reports prepared in early June and a second report. The pages cover different periods and property types and are commercial, so they are not independent of each other. The second brokerage article gives two different prior readings of months of supply, and one article's 7.1% fall does not match the 7.4% computed from its rounded figures; both are flagged above. The Census figures are five-year estimates for a postal area.
Conclusion
The Lexington record shows values up 12.4% on one page and a sold median down 13.8% on another, a single-family average of $1,990,000 on 86 sales, clocks from 7 to 33 days, a share of homes sold above list that fell by 17.5 points and a stock where 61.6% of homes predate 1980. The pages differ because they measure different things in different windows, and because a small number of sales moves an average.
Frequently Asked Questions
What is the median home price in Lexington, Massachusetts?
Pages differ. Redfin showed $1.6 million for the three months to August 2026, Realtor.com showed a sold median of $1,726,500 in June, and Zillow shows a typical value of $1,593,394.
Did Lexington home prices fall in 2026?
Pages disagree. Zillow shows values up 12.4%, Redfin shows its sold median down 13.8%, and a brokerage reports the single-family average down 7.1% while saying the fall reflects which homes sold.
How long do homes take to sell in Lexington?
Zillow shows around 7 days to pending, Realtor.com showed 27 days on market in June and Redfin shows 28 days for the three months to August.
How much is 1% of a Lexington home price?
It is $16,000 at $1,600,000 and $19,900 at $1,990,000. At 3% those amounts are $48,000 and $59,700. This is arithmetic and not an agent's rate.
Can I sell my Lexington home privately?
Yes. Maison Off-Market buys luxury homes and estates directly from their owners with no showings, flexible closing dates, no commission costs, no closing costs and no inspections or repairs. Call 401-219-4207 or use the contact form.
Compare your options before committing. Request a written private offer for your property, with no obligation, then weigh it against your listing plan.
Sources
- Realtor.com, 2026. Lexington, MA Housing Market and Rental Trends. https://www.realtor.com/local/market/massachusetts/middlesex-county/lexington.
- Redfin, 2026. Lexington Housing Market. https://www.redfin.com/city/36128/MA/Lexington/housing-market.
- Zillow, 2026. Lexington, MA Home Values. https://www.zillow.com/home-values/19005/lexington-ma/.
- Local brokerage blog, 2026. Lexington's Price Slip Is a Mix Story. https://www.commonwealthstandard.com/insights/lexington-mas-199m-price-slip-is-a-mix-story.
- Local brokerage blog, 2026. Lexington Homes Hit 4.23 Months of Supply. https://www.gundersheimgroup.com/insights/lexington-homes-hit-423-months-of-supply.
Related research

Seller Guide · October 6, 2026
How to Prepare Point Pleasant Beach Rental Records Before Selling
Separate rental approval, income history and booked stays before comparing sale terms.

Seller Guide · October 6, 2026
How to Prepare Rumson Flood and Waterfront Records Before Selling
Separate flood disclosure, elevation, repairs and waterfront rights before comparing sale terms.

Seller Guide · October 6, 2026
How to Prepare Sarasota Condo Inspection and Reserve Records Before Selling
Separate building condition, reserve funding and resale documents before comparing sale terms.