Market Brief · by Aidan Sowa · October 5, 2026
Are Five Points Sellers Losing Pricing Power as Price Cuts Climb? Reading Redfin, Realtor.com and the Census Renter Base
Reading Redfin, Realtor.com and the Census Renter Base for Five Points, NC, with each source dated and its limits noted, for owners weighing a listing against a direct sale.
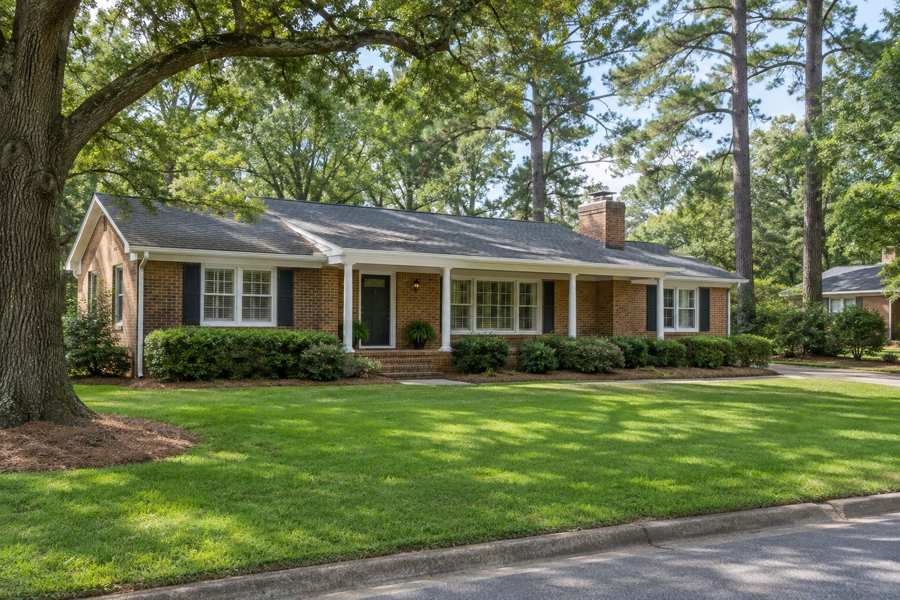
Are Five Points sellers losing pricing power as price cuts climb? Redfin's page for Five Points, for the three months ending June 2026, shows a median sale price of $994,654, up 15.7%, 65 homes sold in June against 55, 29 days on market against 33 and a Compete Score of 60. It also shows that 40.5% of listings had price drops, up 17.9 points in a year, and that 20.6% of homes sold above list, down 6.7 points. The two halves of that page point in different directions: prices and sales are up, and so are the cuts.
The wider area adds a second view. Realtor.com's page for the postal area, for June 2026, shows a median sold price of $1,085,000, up 3.33%, a median listing price of $1,137,000, down 14.93%, 118 active listings, up 4.95%, and 59 days on market, up 103.03%. The Redfin neighborhood median is 8.3% below the postal area sold median, computed here, which makes Five Points a step down in price from its sibling Hayes Barton, where Redfin shows a median near $1.4M.
Maison Off-Market speaks only to sellers, and this brief is for an owner in Five Points. It shares its Census postal area with Hayes Barton, which has its own brief on the age of homes, so this one takes the cut on renters, rents and how long owners have stayed. Every figure below is dated and linked, the arithmetic is shown, and inferences are labeled.
Key Findings
- Redfin's page for Five Points, for the three months ending June 2026, showed a median sale price of $994,654, up 15.7%, $417 per square foot, down 12.0%, 65 homes sold in June, up 18.0%, 29 days on market against 33, a Compete Score of 60, a sale-to-list ratio of 98.9%, down 0.094 points, 20.6% of homes sold above list, down 6.7 points, and 40.5% of listings with price drops, up 17.9 points. Over three months the average home sold about 1% below list and went pending in around 42 days, and the hottest homes sold around list in around 9 days (Redfin, Five Points housing market). The page title says as of July, while its data run to June.
- Realtor.com's page for the postal area, for June 2026, showed a median listing price of $1,137,000, down 14.93% in a year and up 4.65% in three, a median sold price of $1,085,000, up 3.33% and up 49.66%, $473 per square foot, down 3.59%, 118 active listings, up 4.95%, 59 days on market, up 103.03%, 75 rental listings, down 23.46%, and a median rent of $1,819, down 12.08% (Realtor.com, postal area housing market). It rated the market warm and balanced, with a sale-to-list ratio of 100%.
- Realtor.com's report on the Raleigh-Cary area, dated October 3, 2026, showed a median list price of $445,000, down 2.6%, 59 days on market, active listings up 7.6% to 6,125, and 24.1% of listings with a price cut (Realtor.com, Raleigh-Cary market report).
- The share of Five Points listings with price drops on Redfin, 40.5%, is well above the 24.1% for the Raleigh-Cary area on Realtor.com, though the two sources count price cuts over different windows.
- In the Census postal area that includes Five Points, 23.8% of occupied homes are rented, 76.2% are owner-occupied, 67.3% of owners moved in since 2010, the median owner value is $977,400, plus or minus $79,276, the median rent is $1,878 and the median household income is $162,188 (U.S. Census Bureau, American Community Survey 2020-2024 five-year estimates, via Census Reporter).
How do the Five Points price figures compare?
Redfin's $994,654 is the median sale price across all home types for the three months ending June 2026. It is up 15.7%, which implies about $859,684 a year earlier. The same page shows $417 per square foot, down 12.0%, which implies about $474 a year earlier. A median up 15.7% beside a per-foot price down 12.0% would mean that the homes that sold this spring were considerably larger than those a year before. That is a reasonable inference from the two figures, and it fits a month in which 65 homes sold, 10 more than a year earlier.
The postal area figures are higher. Realtor.com's sold median of $1,085,000 is 9.1% above the Redfin neighborhood median, and its per-foot price of $473 is 13.4% above Redfin's $417, computed here. The listing median of $1,137,000 is down 14.93% in a year, which implies about $1,336,546 a year earlier, while the sold median is up 3.33%, which implies about $1,050,034. The two moved 18.3 points apart. A listing median that falls while a sold median rises is a sign that the mix of homes listed has shifted toward lower-priced homes, which is an inference.
The Census anchors the range. The median owner value of $977,400, plus or minus $79,276, is 98.3% of the Redfin neighborhood median and 90.1% of the postal area sold median, computed here. Unlike in many places, owners' own estimates are close to recent sale prices, which suggests that long-time owners have kept pace with the market, or that the sales are of homes close to the typical one.
Over three years the postal area looks strong. The sold median is up 49.66%, which implies about $725,000 three years ago, and the listing median is up 4.65%, which implies about $1,086,000. A sold median that rose by half while the listing median barely moved is hard to reconcile, and a seller should not read the three-year sold figure as a trend. The one-year and neighborhood figures are more useful.
Check the sample before leaning on any of this. Redfin's three-month window covers 65 sales in June alone, and the page does not print the count for the other two months, so the median probably rests on well over a hundred sales. That is a far firmer base than the six sales behind the Hayes Barton figure in the sibling brief, and it is one reason Five Points numbers deserve more weight than those of its smaller neighbor. A median is still a middle, though, and a range from a modest house to a large one sits around it.
For a seller, the practical range is about $995,000 to $1,085,000 for the middle of the market, with a wide spread around it. A house in the lower end of the neighborhood and one in its higher end are different products. The best price evidence is a closed sale of a comparable home on a nearby street in the past six months.
| Source | Figure | What it measures |
|---|---|---|
| Redfin | $994,654, up 15.7% | Median sale price, Five Points, three months to June 2026 |
| Census Reporter | $977,400 | Median owner value, postal area |
| Realtor.com | $1,085,000, up 3.33% | Median sold price, postal area, June 2026 |
| Realtor.com | $1,137,000, down 14.93% | Median listing price, postal area, June 2026 |
Sources as cited. Ratios and year-earlier values in this section are computed from the published figures and percentages.
Why are price cuts climbing in Five Points?
The standout figure on the Redfin page is the share of listings with price drops, 40.5%, up 17.9 points, which implies about 22.6% a year earlier, computed here. That is a rise of 1.8 times in a year. At the same time the share of homes sold above list fell 6.7 points to 20.6%, which implies about 27.3% a year earlier, and the sale-to-list ratio slipped by 0.094 points to 98.9%. Sellers are asking more than buyers will pay, cutting, and selling just below the final ask.
A rise in price cuts does not by itself mean falling prices. When many sellers list at an optimistic price and then trim it, the median sale price can still rise. Redfin's median is up 15.7%. The data fit a market in which sellers tried a higher ask, found resistance and reduced it. That is an inference, and it matches the postal area page, where listings are up 4.95% and days on market have more than doubled, up 103.03%.
Pace is steady on the neighborhood page. Redfin shows 29 days on market against 33 a year earlier, and an average of around 42 days to pending over three months, with the hottest homes going pending in around 9 days. The Compete Score of 60 is somewhat competitive. Realtor.com shows 59 days for the postal area, which implies about 29 a year earlier. So the postal area slowed, and the neighborhood did not.
The metro context points the same way. Realtor.com's report for Raleigh-Cary dated October 3, 2026 shows 24.1% of listings with price cuts, active listings up 7.6% to 6,125 and a median list price down 2.6%, and describes negotiating power moving toward buyers. Five Points, with 40.5% of listings cut, is above that figure, although the sources count cuts over different windows, so the comparison is rough.
Hot homes behave differently from the rest. Redfin says the hottest Five Points homes go pending in around 9 days and sell around list price, while the average home takes around 42 days and sells about 1% below list. The gap of about 33 days, computed here, is the cost of a house that does not fit what buyers want at its price. Those homes are the ones that collect the price drops, and a seller who studies which homes sold in 9 days will find that price and condition matched.
What follows for a seller is simple. A first price that is too high costs time and then a cut that every buyer sees. A realistic first price keeps the home out of the group of 40.5%. A private buyer avoids the cycle altogether, since there is no public price history to read.
Sources as cited. Year-earlier values and differences are computed from the published percentages.
What do renters and rents say about Five Points?
The postal area is mostly owned, but its renters matter to the market. Of 5,375 occupied homes, 1,278 are rented, 23.8%. Of those renters, 684, or 53.5%, moved in since 2020, 473, or 37.0%, between 2010 and 2019 and only 9.5% before 2010. Renters turn over fast, and their landlords make up part of the supply of homes that come to market.
Rents are soft. Realtor.com shows a median rent of $1,819 for the postal area, down 12.08% in a year, which implies about $2,069 a year earlier, and 3.96% lower than three years ago. Rental listings are 75, down 23.46%, which implies about 98 a year earlier. The Census median rent is $1,878, so the two are within 3.2%, computed here. Fewer rentals at lower rents is a mixed signal. It may mean that renters are fewer, or that the rentals listed are smaller.
Burden is moderate. Among 1,252 renter households with a computed burden, 354, or 28.3%, spent 30% or more of income on rent, and 222, or 17.7%, spent half or more. At the median household income of $162,188, the median rent of $1,878 is 13.9% of monthly income, so rent is a small share for most households here.
Most rented homes are mid-sized. Of 1,278 renter households, 817, or 63.9%, live in a home with two bedrooms, 262, or 20.5%, in one with three, and 199, or 15.6%, in a home with none or one bedroom. Large houses in this postal area are owned, and the owners are the main sellers.
Think about where tenants and owners meet. A postal area with 1,278 rented homes among 5,375 occupied has landlords who are small owners, and some will sell into a market where price cuts are common. When several such homes come to market together, they compete with each other, and a seller of an owner-occupied house competes with them too. That is an inference from the counts, and it is a reason to price against recent closed sales and not against current asking prices.
For an owner who rents out a house in Five Points, the data are a prompt to look at the actual lease and the actual costs. A landlord whose rent has fallen or whose tenant has moved may find a sale easier than a re-let, and a private buyer that takes a home with or without tenants can simplify the choice.
Source: U.S. Census Bureau, American Community Survey 2020-2024 five-year estimates, tables B25003, B25038, B25070, B25042 and B25064, via Census Reporter, with Realtor.com rent figures as cited. Shares are computed here.
How long have owners stayed in Five Points?
Owners are recent. Of 4,097 owner households in the postal area, 82 moved in during 2023 or later and 736 between 2020 and 2022, so 818, or 20.0%, moved in since 2020. Another 1,941, 47.4%, moved in between 2010 and 2019, 551, 13.4%, between 2000 and 2009, 402, 9.8%, between 1990 and 1999 and 385, 9.4%, before 1990. In all, 67.3% of owners arrived since 2010 and only 19.2% before 2000.
Recent buyers have seen the largest gains. Realtor.com's three-year sold median is up 49.66%, and a household that moved in during 2010 to 2019 has held through most of that rise. Gains of that size give owners room to sell below the peak and still come out ahead. They also explain why some sellers will wait out a slow month, and why others take the first firm offer.
Mortgages are common but costs are light. Of 4,097 owners, 2,642, or 64.5%, have a mortgage and 1,455, or 35.5%, do not. Among those with a mortgage, 676, or 25.6%, spent 30% or more of income on housing, and 335, or 12.7%, spent half or more. Among owners without a mortgage, 37, or 2.5%, spent 30% or more. Taken together, 713 of 4,097 owners, 17.4%, carry a heavy cost, so most can choose the timing of a sale.
A seller in that position can wait for the right buyer, and the market data suggest the wait may be about six weeks to pending, plus a closing period. A seller who cannot wait, because of a job, a school year or a purchase elsewhere, has a different problem, and the price cuts on 40.5% of listings show what happens to those who need to sell quickly after a high first price.
Owners here live in large homes, with 84.7% of owner households in three or more bedrooms and 54.7% in four or more, which means that a typical Five Points sale is a family house. The buyers are families who need the space, and they compare houses on condition, school zone and street. That points back to the best evidence a seller has: what a similar house on a nearby street actually sold for.
Age adds a last angle. A buyer who plans to stay ten years will pay more for a house than one who expects to move in three, and a postal area where 67.3% of owners arrived since 2010 has many households who have already moved once. Those owners know the cost of selling, having paid it, and many will compare the quoted fees with the net from a direct sale. For them the first figure to check is the cost line on the closing statement of their last sale. Readers comparing markets can also read the Hayes Barton brief and the North Raleigh brief.
Source: U.S. Census Bureau, American Community Survey 2020-2024 five-year estimates, tables B25038, B25091 and B25042, via Census Reporter. Shares are computed here.
What should a Five Points owner ask, and what does a private sale change?
Five questions are worth asking. What did comparable homes nearby actually close for? How long will a sale take at a realistic price, and what does waiting cost? What will the fees be? How much of the price survives the buyer's inspection? Who will see the house, and who will know it is for sale?
Fees are simple arithmetic and no rate is assumed here. Each 1% of a $450,000 sale is $4,500, of a $725,000 sale is $7,250 and of a $1,200,000 sale is $12,000. Three percent is $13,500, $21,750 and $36,000, and five percent is $22,500, $36,250 and $60,000. A seller can put their own quoted costs into those rows. On the Redfin median of $994,654, 1% is $9,947.
One more point on timing. Redfin's data end in June, and the Raleigh-Cary report that follows it is dated October 3, 2026, so the neighborhood figures are several months old by now. A seller should ask for sales from the summer, since a market with price cuts climbing can move quickly in either direction. A direct buyer looks at the home as it is today and quotes a price for it, which avoids the problem of stale data altogether.
With 40.5% of listings being cut, a public price history is a real cost. A buyer who sees a cut starts the negotiation from the lower figure. A private sale has no public price and no history, which is part of the first benefit, privacy. It has no showings and no neighbors talking about it.
The second benefit is a closing date that suits the seller. The third and fourth are no commission costs and no closing costs. The fifth is no inspection repairs, which matters in a postal area where 55.3% of homes were built before 1980.
Maison Off-Market buys luxury homes and estates directly from their owners and speaks only to sellers. It does not say that a private sale always beats a public listing, and in a market where price cuts are climbing, an owner is right to compare an offer with what the same home would net after costs. If you would like a private, no-obligation offer for a home in Five Points, call 401-219-4207 or use the contact form on this site.
Sources as cited. Fee illustrations are arithmetic only and assume no commission rate.
Methodology and limitations
Each page's date, title and place were read before use. The Redfin page is for the three months ending June 2026, although its title says as of July. The Realtor.com postal area page is for June 2026, and the Raleigh-Cary report is dated October 3, 2026. No Realtor.com or Zillow page for Five Points itself was found, and the postal area page is used instead. Price-cut shares on Redfin and Realtor.com are counted over different windows and compared only roughly. Only established data publishers and the Census are cited. The Census figures are five-year estimates for the postal area that includes Five Points, shared with a sibling post on Hayes Barton. Percent changes were taken as printed, and ratios, sums, fee figures and year-earlier values are this brief's arithmetic.
Conclusion
The record for Five Points shows a neighborhood median of $994,654, a postal area sold median of $1,085,000, a sale-to-list ratio of 98.9%, price cuts on 40.5% of listings and owners who mostly arrived since 2010. The useful number for an owner is a closed sale of a comparable home nearby, and a private buyer can price the home in front of them.
Frequently Asked Questions
What is the median home price in Five Points?
Redfin shows a median sale price of $994,654 for the three months ending June 2026, and Realtor.com shows $1,085,000 sold for the postal area in June 2026.
How long do homes take to sell in Five Points?
Redfin shows 29 days on market and a typical time to pending of about 42 days over three months.
How common are price cuts in Five Points?
Redfin shows that 40.5% of listings had price drops, up 17.9 points in a year.
What does the Census say about owners near Five Points?
In the postal area, 76.2% of occupied homes are owner-occupied and 67.3% of owners moved in since 2010.
Can I sell my home in Five Points privately?
Yes. Maison Off-Market buys luxury homes and estates directly from their owners with no showings, flexible closing dates, no commission costs, no closing costs and no inspections or repairs. Call 401-219-4207 or use the contact form.
Compare your options before committing. Request a written private offer for your property, with no obligation, then weigh it against your listing plan.
Sources
- Redfin, Five Points housing market, 2026. Five Points, Raleigh Housing Market: House Prices and Trends. https://www.redfin.com/neighborhood/764049/NC/Raleigh/Five-Points/housing-market.
- Realtor.com, postal area housing market, 2026. Housing Market Data, Raleigh, NC Home Prices and Rental Trends. https://www.realtor.com/local/market/north-carolina/zipcode-27608.
- Realtor.com, Raleigh-Cary market report, 2026. Raleigh Inventory Surges as Prices Slip and Buyers Gain Ground. https://www.realtor.com/news/local/raleigh-nc/real-estate-market-raleigh-nc-september-2026/.
Related research

Seller Guide · October 6, 2026
How to Prepare Point Pleasant Beach Rental Records Before Selling
Separate rental approval, income history and booked stays before comparing sale terms.

Seller Guide · October 6, 2026
How to Prepare Rumson Flood and Waterfront Records Before Selling
Separate flood disclosure, elevation, repairs and waterfront rights before comparing sale terms.

Seller Guide · October 6, 2026
How to Prepare Sarasota Condo Inspection and Reserve Records Before Selling
Separate building condition, reserve funding and resale documents before comparing sale terms.